
Retirement Planning Success: Impact of Market Declines on Monte Carlo Simulations
Abrin Berkemeyer CFP®, AIF®, Associate Advisor
As we know, markets move in three directions: up, down, and sideways. When the market declines, it can leave many wondering “am I still on track to meet my financial goals?” Monte Carlo simulation is one tool within a financial plan that can help address this question.
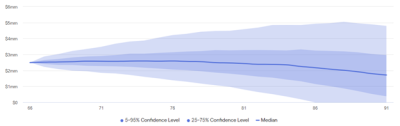
Monte Carlo simulation incorporates market downturns into planning by randomizing the individual annual returns that achieve an  expected long-term rate of return. A typical Monte Carlo simulation will run a portfolio and its contributions and distributions through 1000 different sequences of returns, or trials. If the portfolio still has money in it at the end of the trial it is considered successful. If the portfolio runs out of money along the way, the trial is considered unsuccessful. These trials can then be aggregated to see how many times the plan was successful on a percentage basis. If 810 of the 1000 trials are successful, there is an 81% chance that the portfolio’s returns will support the financial goals of the plan. The range of trial outcomes can also be graphed to show the spread and probability of different ending portfolio values.
The probability of success and range of trial outcomes will change depending on the goals of the plan. These include but are not limited to life expectancy, spending rates, and risk/return assumptions. Here is another range of trial outcomes for a portfolio where the spending need is lower.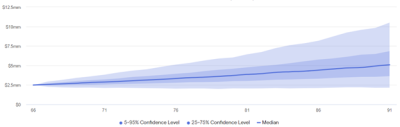
In these ways, Monte Carlo simulations help us quantify the impact of varying year over year returns. For someone retired and relying on portfolio distributions to cover spending, the sequence of returns can affect the portfolio’s longevity. Graphic 1 below shows a $2,500,000 portfolio, with a $100,000 annual withdrawal rate and 5.98% annualized rate of return yielding different ending values depending on the sequence of returns. For trials where negative returns happen earlier in the distribution phase of the plan, the inability to recoup the losses on the amount distributed is what can lead to unsuccessful trials.
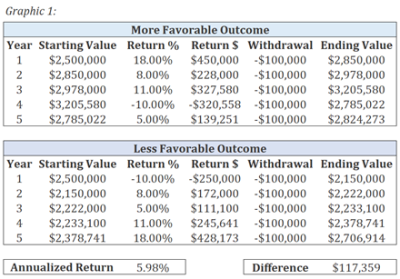
When losses in a trial happen toward the end of the distribution phase (typically the end of the plan), those losses tend to have less of an impact on results because spending goals have already been achieved up to that point. While Monte Carlo simulation is a great tool that considers the numerous assumptions within a financial plan and helps quantify the uncertainty of future market returns in an easily digestible percentage figure, it isn’t without its limitations. For one, while the final percentage probability may seem predictive, it isn’t. In reality, the market returns will only end up playing out to be one sequence of returns and even if it is similar to one of the 1000 trials, it is impossible to know which trial is being lived through. Another limitation is that Monte Carlo simulations may produce different probabilities of success year to year as market cycles unfold and actual returns are realized. In one year, the probability of success may be 80% and the next 75% if there was a year of negative returns between running the simulations. While this makes sense on a surface level, which set of simulations should be trusted for the long-term? The one performed in the down year, or the one performed the year before.
Overall, despite some limitations, Monte Carlo simulations are incredibly useful. The analysis tool helps facilitate more meaningful conversations about the impacts of markets that move up, down and sideways that would be hard to visualize and understand otherwise. By calculating a probability of success, Monte Carlo simulations can provide investors with a certain degree of confidence that their financial goals may not be derailed because markets are currently in decline.
