

Mighty Mid-Caps
Our clients have long heard us espouse the value of having some exposure to small-cap stocks, referring to Morningstar/Ibbotson data that evidences how small-caps have outperformed large-cap stocks over extended periods of time. But what about mid-cap stocks? While we include them as an important part of our clients’ portfolios, mid-cap stocks get little mention in the investing realm and in fact we don’t mention them nearly enough either.
So, just what is a mid-cap stock? First, let’s define “market capitalization” or “market cap” as it’s commonly called. As in large-cap and small-cap, the “cap” refers to the capitalization of the underlying company stocks. This is a simple calculation of the given company’s stock price times the number of shares outstanding for that company. For example, XYZ Company has 10 million shares outstanding and trades for $50 per share – its market cap would then be $500 million. Large, mid and small caps are then grouped by company market caps in given ranges. For example, as of April 30, 2018, index provider Standard & Poor’s (S&P) has market cap ranges for its indexes as follows: S&P 500 Large-Cap Index – $3.2 billion to $839 billion; S&P 400 Mid-Cap Index – $1.0 billion to $13.3 billion; and the S&P 600 Small-Cap Index – $70 million to $4.981 billion.
You probably noticed that there is some overlap in the ranges between the indexes; this is due to stocks rising and falling in value over time after entering their respective indexes and it’s also a good predictor of those stocks that will likely be promoted or demoted between the indexes. Interestingly, widely-followed Morningstar actually adds two additional market-cap ranges to the above three — “Giant” and “Micro” — splitting them off the large and small cap ranges, respectively. Finally, as a good rule of thumb, the generally accepted market cap range for mid-cap stocks is roughly $3-10 Billion.
For example, as of April 30, 2018, index provider Standard & Poor’s (S&P) has market cap ranges for its indexes as follows: S&P 500 Large-Cap Index – $3.2 billion to $839 billion; S&P 400 Mid-Cap Index – $1.0 billion to $13.3 billion; and the S&P 600 Small-Cap Index – $70 million to $4.981 billion.
You probably noticed that there is some overlap in the ranges between the indexes; this is due to stocks rising and falling in value over time after entering their respective indexes and it’s also a good predictor of those stocks that will likely be promoted or demoted between the indexes. Interestingly, widely-followed Morningstar actually adds two additional market-cap ranges to the above three — “Giant” and “Micro” — splitting them off the large and small cap ranges, respectively. Finally, as a good rule of thumb, the generally accepted market cap range for mid-cap stocks is roughly $3-10 Billion.
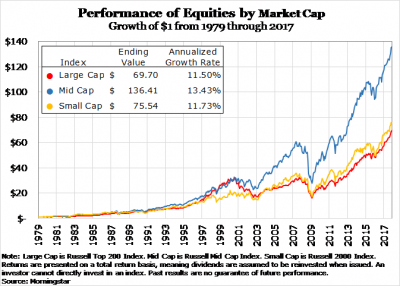
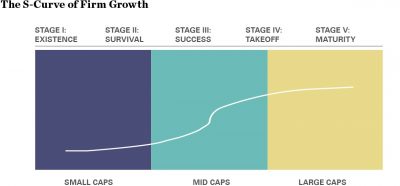
So, how have mid-cap stocks performed over time relative to large-caps and small-caps? Using Russell index data from Morningstar going back to 1979 (the earliest this data is available) we validate that Russell mid-cap stocks generated 13.43% annualized returns through 2017, significantly beating both large and small stocks. This can be seen graphically in the accompanying chart. So, what might explain this significant level of outperformance you might ask? Well, mid-cap companies are in the sweet spot of corporate existence. As graphically described in the accompanying chart found below, these companies have matured through their early days where risk of survival is at its highest. While they are large enough to have survived, they are still small enough to generally have higher growth than their larger cap peers. Call it the law of large numbers – it’s harder for a large-cap or “mega-cap” company to grow at high rates than it is for a much smaller company. By the time the mid-cap company reaches its full potential and is then recognized in the market with a higher stock price, it can then graduate into the large-cap realm whereby it is “kicked out” of the mid-cap indexes and into the large-cap indexes…just as its growth has often peaked. Furthermore, its performance as a mid-cap stock is permanently etched into those mid-cap index returns and how it performs as a large-cap stock (often not as well) is no longer reflected there. Mid-cap companies are also fertile fishing grounds for acquisitions by large-cap companies looking to consolidate their markets or to acquire needed growth. Of course, these acquisitions are often done at attractive premiums to the pre-acquisition traded stock values.
As you have probably noticed, over the recent past we have been slowly reducing our exposure to large-cap stocks as their valuations have risen to now unattractive levels and we have been moving in the direction of increasing mid-cap exposure where we see better growth and valuations. Given mid-cap stocks now make up roughly 30-40% of our clients’ equities, we expect to benefit if this trend continues.
